Monday, July 28, 2008

Position, Position, Position

Rain gauges, like most meteorological instruments, should be placed IMGP4465far enough away from structures and trees to ensure that any effects caused are minimised. The Nylex Rain Gauge 1000 instruction leaflet suggest the gauge should be located twice as far away as the height of nearby buildings and trees (ie if your house is approx. 3m high then the gauge should be 6m away!) I have two of these rain gauges (normally at different locations) but I have already noted that then can give different readings with only small separation. The main culprit is wind. nearby obstacles can cause shadows and eddies and if the gauges is too exposed eddies in strong winds can carry away up to 20% of the rain. Finding a good site is a standard suburban block can be a challenge and using two gauges (these can be homemade) at various locations is a good way to select best location to permanently mount your rain gauge.
Swalim (the Somalia Water & Land information Management) project has put their comprehensive Rainfall Observers Manual on the net.
The rain gauges that come in most weather station kits are based on tipping buckets. These are generally not as accurate at the conventional graduated cylindrical collectors, for a couple of reasons. A certain amount of rain is needed to tip the buckets and the rain event may finish before the bucket is tipped, where the rainfall is infrequent and low this can be an issue. Also the tripping mechanism may have considerable tolerance (most are made of molded plastic) and it may be wise to "calibrate" the readings against a convention gauge (using a few decent rain events of perhaps 2mm of more)
Sunday, July 27, 2008

Handling the pressure

Aneroid Barometers are the most common way to measure atmospheric pressure. But the first barometers use columns of displaced mercury to measure pressure, which is why pressure was originally measured as inches of Mercury (InHg) or millimetres of Mercury (mmHg). At the beginning of the 1900s the millibar (and bar) was introduced as the international measure of atmospheric pressure. Today most instruments give measurements in hectopascals.
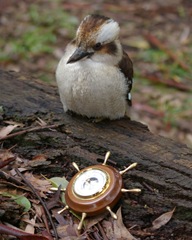
The earth atmosphere gets thinner with height, because of the weight of air above it is less. Infact an aneroid barometer can be used to measure altitude. Air pressure gets roughly 1 hectopascal (Hpa) lower for each 10 metres of ascent. To test this I took my reference barometer (a decorative one rather than a highly precise instrument) for a drive up to Olinda in the Dandenong ranges. I got a rough reading from Google Earth that I started at 74m and reached 577m elevation at Olinda (this is most probably several 10s of metres out by the way but I was only interested in relative height difference and have assumed that both estimates are similarly out). The initial reading of the barometer was 1010 HPa and was 960 Hpa after I let it rest forIMGP4454 a while on an old tree log at Olinda. An inquisitive Kookaburra took an interest (presumably seeing if it was edible). So there was approx. 500m difference in elevation and the air pressure dropped 50 Hpa. My old barometer seems ok, and a worthy calibration companion for my new weather station.
Most published weather charts show the air pressure at sea level (MSLP, Mean Sea level Pressure) and so it has become a convention to set barometers used in weather prediction to a "relative" pressure at sea level. Normally you can obtain this by finding details of a nearby  government weather observatory (BOM Bureau of Meteorology in Australia) and adopting that pressure as your reference. Modern aneroid barometer often have a small adjustments on the back to do this. Digital barometers and weather station usually have a set/calibrate procedure, to change the displayed reading.

Saturday, July 26, 2008

Weather Station Gwondana

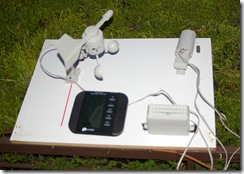
IMGP4366Rather than just think conspiracy theories about the dams and rainfall I  figure it might be more constructive to start observing the weather events myself. Surprising it is possible for anyone (with an interest in weather) to do some simple observations themselves and become proficient in local weather forecasting themselves (at least that what the Discover Nature in the Weather websites say).

All that is required is some simples measuring apparatus, and most of that can be homemade if you want. The key items are -

  1. Rain gauge
  2. Thermometer
  3. Barometer
  4. Hygrometer
  5. Wind vane (and anemometer)

Whilst I have "analogue" version of all these apparatus and know how to use them I was inspired to go "digital" and get a wireless weather station that has an "indoor" LCD control panel,  that receives data wirelessly from external mounted measurement devices. Its not a model that can be connected directly to a computer (and then the net) that would make this extravagance way too expensive.

So my weather station is in (just above my cretaceous garden, and over the next few weeks I will be calibrating things. After that you can expect some weather observations to start appearing in here.

Sunday, July 13, 2008

I am not normally a fan of conspiracy theories

Looking at the published levels of stored waters in our dams in Melbourne is a little depressing, it is only just at 30% of capacity at a time when there have been some decent rain events (I have rain gauges and tanks), so is there a conspiracy are we being told the truth?

annual_lrg

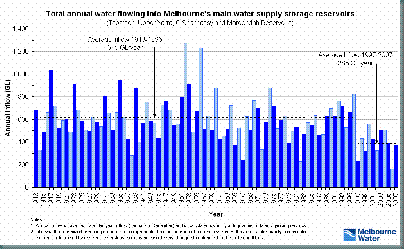
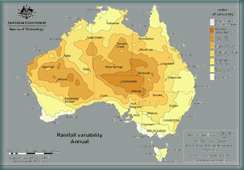
I started looking to find an independent way to verify this (ie not just looking at one source of data). If you look at the Melbourne Water website they have a graph that shows the inflows into the dams over 2007 are roughly at the average for the last 10 years but that they were only half this in 2006. varannI then look at the Bureau of Meteorology statistics (see graph below), it is clear that rainfall is below average (between half and three quarters of this part of Australia. So superficially thing check out.

However at a more detailed level things don't seem to match up. We should have had lower levels in the dams last year, but it seems a lot of water was "taken" from the Thompson scheme. Then A lot of water was lost in some flooding in Gippsland ...etc ... etc the plot thickens, but not quite to a conspiracy level but I do think this has the hallmark of politicians with their hands on what history is being recorded (sorry disclosed).

But where & how to build an independent view?

Wednesday, July 09, 2008

first blushes of spring

  We have just had the first blast of really cold winter weather, even snow, and already the wattles and blossum trees are showing the first blooms. Normally this is an indicator that spring is on its way. So are we in for the shortes winter or are the plants wrong? The observation of naturallt reoccuring events is know as phenology and was the passion of some of great naturalist last century like Thoreau and Darwin. I wonder how many sign from nature we miss every day in our busy lives?
Posted by Picasa